
Emergency Physicians: How Fast is Fast Enough?
September, 2015
Racing legend Mario Andretti famously said, “If everything seems under control, you’re just not going fast enough.” He was talking about cars, but to many beleaguered emergency physicians trying to keep up with the patient queue, emergency medicine often seems this way. This guest blog on emergency physician productivity began as a question to our national association, the Canadian Association of Emergency Physicians (CAEP): Are there any national standards with respect to emergency physician productivity, i.e., expected number of patients assessed per hour? The question was referred to the CAEP Public Affairs Committee and triggered a lively email discussion among our members.
The question is actually a common one I’ve encountered from emergency directors, hospital administrators and government, but without an easy answer. Dr. David Petrie, an emergency physician and Chief of the Central Zone EDs for the Nova Scotia Health Authority, provided a particularly thoughtful response in our email thread and agreed to expand on it here. The issues he raises are central to the challenges to balancing quality, access and cost efficiency in the provision of emergency care. In a follow-up blog, Dr. Petrie will provide some of his strategies and recommendations.
—Dr. Howard Ovens
How fast is fast enough — for an individual emergency physician?
Patient per hour (PPH) rates have long been used in Emergency Medicine as a rough guide to determine emergency physician (EP) “productivity” and to compare individual workloads (relative to peers in the same work environment). Indeed, PPH rates are a component of fee-for-service (FFS) and other volume-based payment systems. While there is a speed versus quality of care trade-off for the individual patient being treated (being too fast can compromise patient safety), there is also a speed versus quality of care trade-off for the patients waiting: If I am moving too slowly, I am compromising the care of those who are ‘Waiting to be Seen’. Ideally, individually, we should be aiming for that “Goldilocks” optimized PPH rate – not too fast and not too slow.1,2
But there are so many variables in the case complexity mix and practice settings that the PPH number becomes less meaningful when comparing one ED with another, or even when comparing one EP with another within the same department if they don’t work a fully balanced shift type schedule. So weighted PPH rates may still have some utility as feedback to allow individual EPs in a single department to compare themselves with the group, and perhaps as a compensation incentive in the same setting – though this is more controversial.
Is speed the right metric for productivity in an evolving ED environment?
However, when it comes to health-care policy and planning, the utility and meaning of a PPH rate may be problematic. It is tempting for funders in non-FFS settings to use the PPH rate to determine the hours of coverage required for an ED (e.g., average 200 pts/day divided by average 2.5 pts/hr seen by EP = 80 hrs of funded coverage/day), which may significantly underestimate the coverage required for safe care and actually increase wait times. In fact, with the future of emergency medicine adapting to the changing health-care ecosystem, I’m not sure whether the construct of PPH (which intuitively has a lot of appeal) is even valid anymore at a system-planning level.
Given last year’s influential Rand report, titled “The Evolving Roles of Emergency Departments in the United States”3 (which stressed the critical role EDs play in facilitating or preventing hospital admissions); the “Integrated Networks of EM Care” models/literature4; and the increasing role of EDs as diagnostic centres for complex patients and co-ordinators of community care/followup5 and as a hub resource for telemedicine and digital access to acute-care decision-making6, EPs do a lot more these days than just take the next chart off the top of the pile to be seen — which is what PPH reflects.
Twenty-four-hour clinical decision unit pathways7, observations units8, more sophisticated approaches to elder-friendly EDs9, managing boarded in-patients10, managing consulting residents and staff, and managing managers11 all affect our PPH speed.
Nurse practitioners and physician assistants may paradoxically lower EP PPH if they preferentially see low acuity/low complexity patients, leaving the higher acuity/complexity patients for EPs. Or, they may improve EP PPH if they manage the back end of complex patient visits (organizing followup, community care, etc.). Scribes may increase PPH12, and electronic medical records may lower it. Some EDs have triage liaison EPs who start workups in the ambulance hallways or triage area yet are not the most responsible physician in the end. How is this counted? According to the Power study13 in Canada, bedside teaching slows PPH by 13% on average, but the more senior the EM resident, the higher the PPH14.
If a family of ducks crossed the highway in front of you, what would you do?
Furthermore, patient flow in the ED (similar to the complex, non-linear mathematics of traffic flow) is far more about bottlenecks than it is about velocity, and we deal with boarding bottlenecks almost every day of the week in busy, urban, teaching hospitals. Driving home on a busy highway with six lanes moving at 80km/hr rather than 100km/hr is a drag, but nowhere near as bad as all six lanes being funnelled into one lane for a stretch because of construction. A 10-car pile-up caused by an incident 20 km ahead where a driver stopped to let a family of ducks cross the highway is the equivalent of the evening shift getting overwhelmed with ambulance hallway offloads and wait times, not realizing there was a 90-min stretch 6 hrs earlier in the ED where three docs avoided the next chart (“social/behaviour problem, 85 y/o, lives alone”) and the in-patient wards refused three admit transfers to the floor because they were on shift change.
Situational awareness is everything15, and given the non-linear nature of flow16 it is important to address bumps in the road at the inflection point of a slow day moving to a busy day (see figure 1).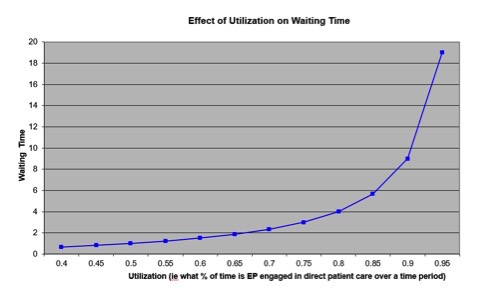 Figure 1: As demonstrated by queuing theory, the relationship between utilization and wait times is non-linear. Wait times double when utilization moves from 80% to 90%, and then double again from 90% to 95% over a period of time.
Vigilant scanning for potential bottlenecks and addressing them as a team is far more important than “head-down moving the meat.” That’s why allowing boarding to occur in the ED is like having a 15-car wreck every day on your commute home and never changing your route, and it doesn’t matter if you drive a Porsche.
Safety lessons from aviation: Safe redundancy – why has health care not understood this?
One final thought about the premise of the PPH question from a policy and planning perspective, which assumes faster is better, as long as quality decision-making is maintained: What is lost in that premise is the concept of safe redundancy. We have learned several things from the safety culture and approach of the aviation industry, such as checklists, standard operating procedures, and simulation, but we have not in health care, and especially in emergency medicine, learned about the need for safe redundancy in complex systems that have a degree of uncertainty in their boundary conditions.
Usually, you don’t need two pilots to fly a jet, you don’t need two engines on a helicopter, you don’t need extra fuel to land at your primary landing site, and you don’t need to plot out a plan B airport (if you assume that plan A is good enough). And yet, none of us would likely get on a commercial jet plane if there were only one pilot in the cockpit and one of the engines were down for repair, and we had only enough fuel to get us to the plan A airport. Yet we do the equivalent of this to our patients (and ourselves) all the time when we work in an ED and in a health system that has not built in some safe redundancy, or surge capacity, into its planning17. There is a pseudo-efficiency of sailing our system too close to the wind18 that manifests itself as access block in the ED, overflowing hospitals, burnout in front-line providers, and most unfortunately (and costly) worse patient outcomes.
Queuing theory, high tides, and preparing for the average day
One of the truisms of queuing theory is: In a system where demand and capacity vary, the average capacity required to keep a queue under control will need to be greater than the average demand. How much greater depends on the amplitude and mismatch of the variations and the maximum waiting times that can be tolerated.19 The corollary of this truism is this: If random variation in demand cannot be smoothed to any significant degree, and the ability to tolerate wait times is limited (in emergency medicine, wait times correlate with mortality in a dose-response relationship that suggests causation20), then policy-makers and patient-centred planners of the health-care system must build safe redundancy/surge capacity into the system. Another metaphor used to understand this is: If you were camping near the ocean on a planet where the tides are unpredictably random and irregular (but vary predictably between a low- and a high-tide mark), would you pitch your tent at the average-tide mark?
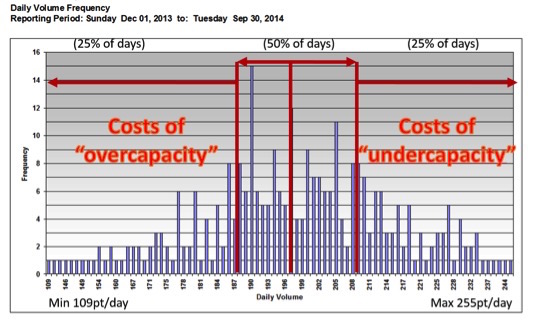 Figure 2: These are actual data from an urban teaching hospital ED showing 10 months of patient volume/day data. Fifty per cent of all days receive between 188 and 209 pts/day, with the slower and busier quartiles extending down to 109 and up to 255 pts/day. In this example, left-without-being-seen visits are 109% higher in the upper quartile than the lower, and 90th percentile wait times for Canadian Triage and Acuity Scale III patients are 41% higher.
How fast is too fast – for departmental planning?
The more random and irregular, time-dependent and high-stakes the demand, the more slack you need in the system to see all “units” of input in a safe manor during surges over time. We do not work in a widget factory with predictable and regular inputs. So planning for an “average” day, and maximizing PPH as a planning strategy, builds in an acceptance that 50% of the days will be more than we are prepared for, and perhaps 25% are overwhelming (see figure 2). Though the worse the boarding, the more this phenomenon is masked because there is no place to see the next sick patient anyway, so “why have more ED capacity” a planner might ask (so dysfunction in the system may justify more dysfunction in a negative feedback loop effect).
Any downtime in a LEAN culture is conflated with inefficiency rather than what it may be: safe redundancy in service of quality patient care, to a point, but obviously too much downtime is just wasteful (see figure 3).
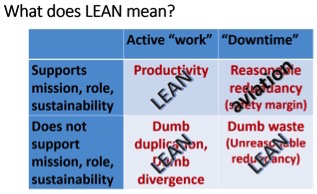 Figure 3: The Institute for Healthcare Improvement describes LEAN as “driving out waste so that all work adds value and serves the customer’s needs” (http://www.ihi.org/resources/Pages/IHIWhitePapers/GoingLeaninHealthCare.aspx). But as the aviation industry so clearly realizes, there is a difference between dumb waste and an appropriate safety margin of surge capacity to respond to unpredictable but inevitable increases in demand.
Interestingly, this may be similar to the same misapplication of a Lean mentality that keeps hospital occupancy rates at >100%, and Canada’s ratio of in-patient beds/1,000 population puts it at 30th out of 34 in its rank among OECD countries21. Driving PPH up assumes that EPs should be working all out, all the time, which misses the point that some degree of extra capacity is patient-centred and improves safety. And the risks/costs are asymmetrical. The risks/costs of having “too much capacity” 25% of the time is easy to measure and attribute to a single budget and assumed to be wasteful – though it is relatively small. The risks/costs of not enough EP capacity 25% of the time is measured in patient mortality, adverse events, and physician burnout, which are harder to measure, not directly on any one budget, but likely more than the costs of so-called overcapacity in the bottom quartile22.
So the relationship between individual PPH rates (which should be safely optimized) and collective, or departmental PPH rates (which should assume a degree of “downtime”), used for policy and planning may be somewhat counterintuitive. The implications of this are very significant to patient safety and system design. I’ll address that in part 2 of this blog.
—Dr. David Petrie
Dr. David Petrie is an emergency physician and trauma team leader at the QEII Health Sciences Centre in Halifax, Nova Scotia. He is the Professor and Head of the Dalhousie Dept EM, and Chief of the Central Zone EDs in the Nova Scotia Health Authority. David’s primary academic interest include the teaching and assessment of critical thinking in medical education and the application of complexity science to Health System Design.
References
- Klauer, Kevin M. “14 Tips to Improve Clinical Efficiency in Emergency Medicine”. ACEPNow 2015 July 15
- Campbell, Samuel G. and Douglas E. Sinclair. “Strategies for managing a busy emergency department”. CJEM 2004; 6(4):271-276
- Gonzalez Morganti, Kristy, and Sebastian Bauhoff, Janice C. Blanchard, Mahshid Abir, Alexandria Smith, Joseph V. Vesely, Edward N. Okeke, Arthur L. Kellermann and Neema Iyer. “The Evolving Roles of Emergency Departments”. RAND Corporation, 2013.
- Martinez, Ricardo, and Brendan Carr. “Creating Integrated Networks of Emergency Care: From Vision to Value.” Health Affairs 2013; 32(12):2082-2090
- Bernstein, Steven L. “ED Care: Available, Competent, Affordable”. Acad Emerg Med 2014; 21(1):73-75
- Scheck, Anne. “Special Report: The ED as the Hub of Health Care”. Emergency Medicine News February 2015; 37(2):16-17
- Schull, Michael J, and Mirian J. Vermeulen, Therese A. Stukel, Astrid Guttmann, Chad A. Leaver, Brian Rowe, Anne Sales. “Evaluating the Effect of Clinical Decision Units on Patient Flow in Seven Canadian Emergency Departments”. Acad Emerg Med 2012; 19(7):828-836
- Martinez, Enrique and Brendan M. Reilly, Arthur T. Evans, Rebecca R. Roberts. “The Observation Unit: A New Interface Between Inpatient and Outpatient Care”. American Journal of Medicine March 2001; 110(4):274-277
- Hastings, Susan N. and Mitchell T. Heflin. “A Systematic Review of Interventions to Improve Outcomes for Elders Discharged from the Emergency Department”. Acad Emerg Med 2005, 12(10):978-986
- Asplin, Brent R., and David J. Magid. “If You Want to Fix Crowding, Start by Fixing Your Hospital.” Ann Emer Med. 2007; 49:273-274l
- Innes, G. “Sorry-we’re Full! Access block and accountability failure in the health care system.” CJEM 2014; 16(0):30-47
- Patel, Sachin and Afsha Rais, Alan Kumar. “Focus On: The Use of Scribes in the Emergency Department”. ACEP March 2012
- Dreyer Jonathan F. and Shelley L. McLeod, Chris K. Anderson, Michael W. Carter, Gregory S. Zaric. “Physician workload and the Canadian Emergency Department Triage and Acuity Scale: the Predictors of Workload in the Emergency Room (Power) Study”. CJEM 2009; 11:321-329.
- XI, Wang and Vikram Dalal. “Impact of Family Medicine Resident Physicians on Emergency Department Wait times and Patients Leaving Without Being Seen”. CJEM 2015; 17(05):475-483
- Howard Ovens “Situational Awareness Advice Sheet” (personal communication)
- Guo, Bing, and Christa Harstall. “Strategies to Reduce Emergency Department Overcrowding.” Alberta Heritage Foundation for Medical Research 2006
- Foster, E. Michael, and Michael R. Hosking, Serhan Ziya. “A Spoonful of Math Helps the Medicine go Down: An Illustration of How Healthcare can Benefit from Mathematical Modeling and Analysis.” BMC Medical Research Methodology 2010
- Taleb, Nassim Nicholas. Antifragile: Things That Gain From Disorder. Random House; November 27, 2012: ISBN 1-400-06782-0
- Lyons, Mike. “Scotland’s Journey from Waiting Times to Quality of Care”. Scottish Government Healthcare Access and Sustainability 2014: 29-33,41,42
- Guttmann, Astrid and Michael J. Schull, Marian J. Vermeulen, Therese A. Stukel. “Association between waiting times and short term mortality and hospital admission after departure from emergency department: population based cohort study from Ontario, Canada”. BMJ 2014; 342:d2983
- Organization for Economic Co-Operation and Development (OECD). OECD Health Statistics 2015
- Ackroyd-Stolarz, Stacy and Judith Read Guernsey, Neil J. MacKinnon, George Kovacs. “Adverse events in older patients admitted to acute care: A preliminary cost description”. Healthcare Management Forum Fall 2009
Dr. Helman, Dr. Pirie & Dr. Ovens have no conflicts of interest to declare
Other FOAMed Resources
The Institute for Healthcare website

[…] Emergency Physician Speed How Fast is Fast Enough – Part I, Dr. David Petrie addressed the issue of physician productivity (patients per hour, or PPH), the […]
I leave a comment each time I like a post on a site or if I have
something to valuable to contribute to the discussion.
Usually it’s caused by the sincerness displayed in the post I looked at. And on this post Emergency Physician Speed – How Fast is Fast Enough : Emergency Medicine Cases. I was actually moved enough to post a thought :-) I actually do have a couple of questions for you if you tend not to mind. Is it simply me or does it seem like some of these comments come across like written by brain dead people? :-P And, if you are posting at additional social sites, I would like to follow you. Could you make a list all of all your communal pages like your twitter feed, Facebook page or linkedin profile?
Thanks “eds driving”! My email and twitter “handle” are shown in my bio – @HowardOvens and [email protected] but I don’t use LinkedIn or Facebook.
David Petrie, our guest author, is not on Twitter, but if you have a message for him email to me and I will forward it for his reply.
Thanks for your comments and interest! howard
Nice Blog. I really enjoyed reading it. Thanks for posting.