
In this ECG Cases blog we look at 6 patients who presented with potentially ischemic symptoms and LVH on their ECG. Which had an acute coronary occlusion?
Written by Jesse McLaren; Peer Reviewed and edited by Anton Helman. September 2020
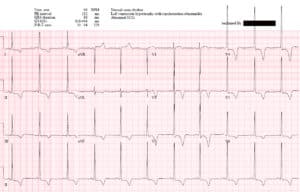
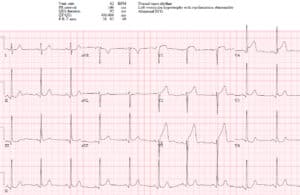
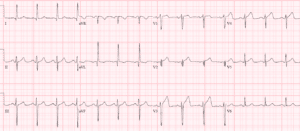
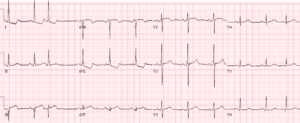
Case 1: 75yo with two hours of chest pain, AVSS.
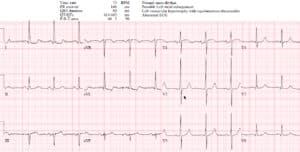
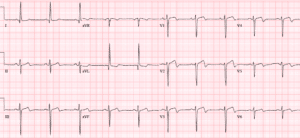
Case 2: 50yo with palpitations and dizziness, AVSS. Old then new ECG
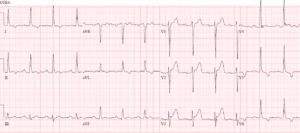
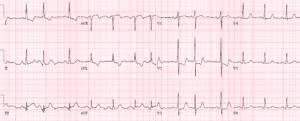
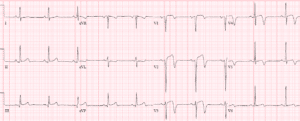
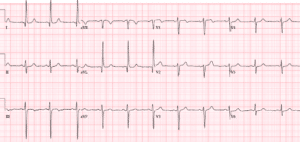
Case 3: 45yo with three hours of constant chest pain and diaphoresis. AVSS.
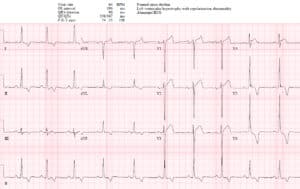
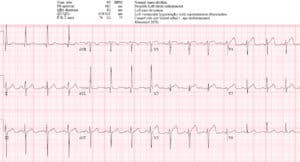
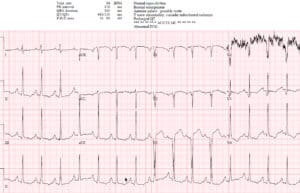
Case 4: 85yo one hour SOB, AVSS. Serial ECG:
Case 5: 70yo one day on/off CP to left arm, constant x 5hours, AVSS. Serial ECG
Case 6: 60yo recent exertional chest pain, then acute chest pain followed by VF arrest, cardioverted. ROSC without RONF
LVH and occlusion MIs
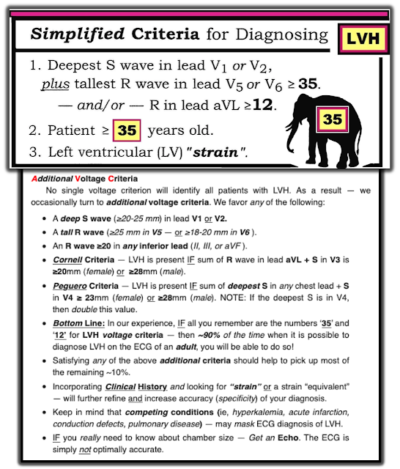
Hypertrophy of the left ventricle produces higher voltages towards the left-sided leads (taller R wave in I, AVL, V5-6) and away from the right-sided leads (deeper S wave in V1-2). There have been dozens of voltage criteria developed for LVH [1], and ECG expert Dr. Grauer has summarized and simplified them in this visual on Dr. Smith’s blog:
![]() Update 2022: A retrospective study of 2184 patients comparing a new ECG screening criterion for LVH called the Semeans’ Sign (presence of QRS complexes touching or overlapping in two contiguous precordial leads) found it was noninferior to both the Sokolow-Lyon criteria and Cornell criterion for men. Abstract.
Update 2022: A retrospective study of 2184 patients comparing a new ECG screening criterion for LVH called the Semeans’ Sign (presence of QRS complexes touching or overlapping in two contiguous precordial leads) found it was noninferior to both the Sokolow-Lyon criteria and Cornell criterion for men. Abstract.
The abnormal depolarization in LVH produces secondary and discordant repolarization abnormalities which can mimic STEMI: anterior convex ST elevation can mimic anterior STEMI, ST depression and T wave inversion in aVL can mimic reciprocal changes in inferior MI, and diffuse ST depression with reciprocal elevation in aVR can mimic this so-called “STEMI-equivalent” pattern. Severe LVH can prolong QRS beyond 120ms and mimic LBBB, which has led to a new definition of LBBB including “QRS duration ≥140 ms for men and ≥130 ms for women, and also mid-QRS notching or slurring in at least 2 of the leads I, aVL, V1, V2, V5 or V6.”[2]
Patients with LVH presenting to the ED with ACS symptoms are older, have more comorbidities, present with more atypical complaints, are more likely to have CHF and have a higher mortality rate [3]. But LVH is also the greatest predictor of false-positive STEMI activation [4]. STEMI guidelines (and the STEMI/NSTEMI dichotomy) don’t help, because both American and European guidelines define STEMI as ST elevation “in the absence of LVH”. So what about those with LVH? As a review explained,
“Neither document defines thresholds for STE in patients with LVH. In addition, there is confusion whether the exclusion of STE thresholds in patients with LVH is limited to leads V2-3 or applies to all leads…Thus, with the lack of specific instructions, it is unclear when exactly a primary percutaneous coronary intervention (pPCI) protocol should be activated for patients with LVH presenting with symptoms compatible with ACS…Comparison to previous ECGs and serial ECGs, looking for dynamic changes may assist in the diagnosis. However, marked fluctuation in the amplitude of ST deviation can be seen over time in patients without active ischemia. The absolute amplitude of ST deviation depends on the amplitude of the QRS complex (edema, effusion and acute pulmonary conditions may decrease the QRS amplitude), QRS width, heart rate, etc. Also, lead positioning and even the position of the patient (supine versus sitting) may have major effects on the ST amplitude.”[5]
Drawing on principles of proportionately (which can help diagnose occlusion MI in the presence of LBBB or LV aneurysm), Armstrong proposed an algorithm to identify anterior STEMI in the presence of LVH: “In patients with STE in leads V1 to V3, an ST segment to R-S–wave magnitude 25% excluded the diagnosis of a STEMI. If the ST segment to R-S–wave magnitude was 25%, presence of STE in 3 contiguous leads or presence of T-wave inversions in the anterior leads classified patients as having a ‘true’ STEMI.” This was based on 79 cath lab activations for patients with LVH (22 with culprit lesions) and had a sensitivity of 77% and specificity of 91% (vs sensitivity of 73% and specificity of 58% for STEMI criteria) [6]. But as a review of new ECG insights into acute coronary occlusion explained, “the study did not assess ECGs with very high right precordial S-wave voltages, which are precisely the ECGs that are difficult. Any ST/S ratio > 15% in the setting of high S-wave voltage in V1-V3 is suspicious for new anterior STE: 15% of a 30-mm S wave is 4.5 mm, whereas a 25% rule would require 7.5 mm of STE.” [7]
Back to the cases
Case 1. HOCM with secondary ST/T changes
- Heart rate/rhythm: NSR
- Electrical conduction: normal intervals
- Axis: normal axis
- R-wave: large voltage, normal progression
- Tension: LVH (Sv1+Rv5>35 + strain; in addition, RaVF>20; Rv5>25)
- ST/T: diffuse T wave inversion discordant and proportional to large voltages
Impression: LVH with secondary ST/T wave changes.
Cath lab was activated because there is diffuse ST depression with reciprocal ST elevation in aVR, but these ST/T wave changes are secondary to LVH). Serial ECGs were unchanged, trops were negative, and echo showed HOCM.
Case 2: LVH with changing morphology/voltages
- H: NSR
- E: normal intervals
- A: normal axis
- R: large voltage, normal progression
- T: LVH (Sv1+Rv5>35 + strain; in addition, II>20, Sv1>35, Rv5>25;)
- ST/T: mild anterior STE and inferolateral TWI, both proportional and discordant to the QRS. On the new ECG the morphology of V3 is more convex and the voltages are greater, with associated deeper lateral T wave inversions
Impression: LVH with changing voltages and associated ST/T changes, leading to false positive cath lab activation. Normal troponin and cath.
Case 3: LVH (but normal S waves V1-3) with LAD occlusion
- H: NSR
- E: normal conduction
- A: normal axis
- R: large voltages, normal progression
- T: LVH (Sv2+Rv5>35 + strain; in addition, RaVF>20; Rv6>20)
- ST/T: STE V1-V4 with hyperacute T waves. In V3 the STE/RS ratio =5/15=33% but this lead has a normal sized S wave that doesn’t contribute to the LVH criteria, so even without the formula this has large STE and a massive T wave (greater than the entire QRS complex).
Impression: occlusion MI. Cath lab activated: 99% mid LAD occlusion (no reciprocal changes). First Troponin I 400ng/L, peak 38,000. Discharge ECG reperfusion T wave inversion:
Case 4: LVH with posterior MI
- H: NSR, PACs in the repeat ECG
- E: normal intervals
- A: normal axis
- R: large voltage with early R wave progression
- T: LVH (RaVL>12 + strain)
- ST/T: STD/TWI in I/AVL which could be secondary to LVH, but LVH should have anterior STE and here there is none (relative ST depression or pseudonormalization). Repeat ECG has deeper ST depression isolated to anterior leads
Impression: LVH with posterior MI (early R wave progression and ST depression isolated to anterior leads). Cath lab activated: 99% distal RCA occlusion. First Troponin I of 50, peak 3500. Discharge ECG regaining normal R wave progression and STE in anterior leads:
Case 5: LVH in limb leads, and subtle LAD occlusion
- H: NSR
- E: normal intervals
- A: left axis from LAFB
- R: high voltage in limb leads, normal in precordial, delayed R wave progression; Q in V2 which increases on repeat ECG
- T: LVH (RaVL>11 + strain; in addition, +Cornell)
- ST/T: mild STE V2-4 less than 25% the RS, with straightening of ST morphology and hyperacute T waves
Impression: concern for LAD occlusion (acute Q + straight STE + hyperacute T wave). Cath lab activated: 99% mid LAD occlusion. First troponin I of 200, peak at 50,000. Discharge ECG had disappearance of acute Q wave, and reperfusion T wave inversion; follow-up ECG months later had normalization of T waves:
Case 6: LVH without signs of occlusion but in high-risk patient with hemodynamic/electrical instability
- H: sinus tach
- E: normal
- A: normal
- R wave: large voltage, delayed R wave progression
- T: LVH (Sv2+Rv6>35 + strain; in addition, inferior lead R>20, Rv6>20)
- ST/T: STE in V3=4/26=15%, lateral secondary STD/TWI
Impression: LVH without obvious signs of occlusion, but patient has very high pretest probability of occlusion MI. Cath lab activated: 80% left main occlusion and triple vessel disease, IABP bridge to CABG. First troponin I of 70, peak at 4,000.
Take away points for LVH and Occlusion MI
- LVH produces secondary repolarization abnormalities that can mimic STEMI. Before looking at ST-segments/T-waves look for signs of LVH and see whether ST/T changes are proportional
- Signs of occlusion MI in patients with LVH include: new Q waves/loss of R waves, disproportionate and dynamic ST elevation (or ST depression from posterior MI), and hyperacute T waves.
References for ECG Cases 13: LVH and Occlusion MI
- Hancock EW, Deal BJ, Mirvis DM, et al. AHA/ACCF/HRS recommendations for the standardization and interpretation of the electrocardiogram. Part V: electrocardiogram changes associated with cardiac chamber hypertrophy: a scientific statement from the American Heart Association Electrocardiography and Arrhythmia Committee, Council on Clinical Cardiology; the American College of Cardiology Foundation; and the Heart Rhythm Society. Endorsed by the International Society for Computerized Electrocardiology. J Am Coll Cardiol 2009 Mar 17;53(11):992-1002.
- Strauss DG. Differentiation between left bundle branch block and left ventricular hypertrophy: implications for cardiac resynchronization therapy. J Electrocardiol Nov-Dec 2012;45(6):635-9.
- Pope HJ, Ruthazer R, Kontos MC, et al. The impact of electrocardiographic left ventricular hypertrophy and bundle branch block on the triage and outcome of ED patients with a suspected acute coronary syndrome: a multicenter study. Am J Emerg Med 2004 May;22(3):156-63
- Prevalence and factors associated with false-positive ST-segment elevation myocardial infarction diagnoses at primary percutaneous coronary intervention-capable centers: a report from the Activate-SF registry. Arch Intern Med 2012 Jun 11;172(11):864-71.
- Birnbaum et al. LVH and the diagnosis of STEMI – how should we apply the current guidelines? J Electrocardiol Sep-Oct 2014;47(5):655-60.
- Armstrong et al. Electrocardiographic criteria for ST-elevation myocardial infarction in patients with left ventricular hypertrophy. Am J Cardiol 2012 Oct 1;110(7):977-83
- Miranda DF, Lobo AS, Walsh B, et al. New insights into the use of the 12-lead electrocardiogram for diagnosing acute myocardial infarction in the emergency department. Can J Cardiol 2018 Feb;34(2):132-145
Leave A Comment